Hooke's Law Experiment
Daniel Goh (28880935)
Assignment I
Introduction
Hooke's law is a physics principle that states that the force, F applied to extend or compress a spring by some distance, X is directly proportional to that distance or extension. Hooke's law has a given formula of F=kX, where k is the stiffness of spring and it is a spring constant in newtons per metre, N/m, and X is the extension of spring in metres, m. The law came from a British physicist Robert Hooke from the 17th century. It was stated in 1660 by him as a Latin anagram. The solution to the anagram was then published by him in 1678 as: ut tensio, sic vis ("as the extension, so the force" or "the extension is proportional to the force")
Experiment
Results
Deformation of y1
X= Force applied (N)
Y1=Deformation of Y1(mm)
Table 1.1
Given the values in Table 1.1, we are able to plot a graph as show below.
From the graph above we are able to get the values of a and b with the equation y1= a1.5583x + 1.375
where,
a= 1.5583
b= 1.375
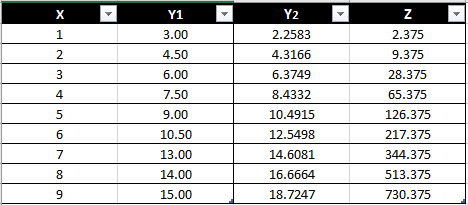
Deformation of y1 and y2
Table 1.2
The table above shows the values for the Deformation of y1 and y2 (mm).
The deformation of y2 can be calculated with the equation,
y2=(a+0.5)x + c
where c = 0.2
Given the values in Table 1.2 we are then able to plot a graph of Force Applied(N) or X against Deformation of y1 and y2, mm.
Force Applied against Deformation of y1 and y2
Referring to the graph above, we are able to obtain the equation of the line of deformation y2 as,
y2 = 2.0583x + 0.2
As the line of best fit is plotted, it indicates that the Force applied (N) is directly proportional to the Deformation of y1 and y2. In other words, as the Force applied increases, the deformation of y1 and y2 increases.
Material y1 is stiffer compared to material y2 as the line of deformation of y2 has a greater gradient compared to the line of deformation of y1.
The point of intersection can be obtained by using the substitution method as shown below.
y1 = 1.5583x + 1.375 ----- ①
y2 = 2.0583x + 0.2 ----- ②
①=②
1.5583x + 1.375 = 2.0583x + 0.2
0.5x = 1.175
x = 2.35
when x = 2.35,
y=2.0583(2.35) + 0.2
y = 5.037
The point of intersection is (2.35 , 5.037)
Deformation of Z
Table 1.3
Table 1.3 shows the deformation of Z.
The deformation of Z can be calculated with equation shown below.
Z = X³ + b
where b = 1.375
From the values given in Table 1.3, we are able to plot the graph of Force applied against Deformation of z, mm.
The graph can be analysed to obtain the equation of line Z as shown below,
Based on the graph, we are able to say that material Z does not obey Hooke's Law because it has entered the plastic region. The exponential line indicates that as force is applied to the material, it will be permanently displaced and will never return to its original form.
Conclusion
Based on the results of this experiment, this experiment relates closely to Hooke's Law. The experiment of material y1 and y2 shows that Hooke's Law is true. The larger the force applied on material y1 and y2, the greater the deformation of material y1 and y2. On the other hand, the experiment of material Z is proven that it does not obey Hooke's Law as material Z is unable to return to its original form and is permanently displaced. Throughout this experiment, a few errors were met that can be improved such as:
1. Human error
- Eyesight must be perpendicular to the metre ruler when taking reading
2. Inaccurate results obtained
- The experiment must be repeated to obtain an average reading
References
1. BBC. 2014. Hooke's Law.
Available at:
[Accessed 14 November 2016].
2. Google UK. 2016. Hooke's Law.
Available at: https://en.wikipedia.org/wiki/Hooke%27s_law.
[Accessed 14 November 2016].


nice
ReplyDelete